- Mon - Fri: 9:00 am – 5:00 pm
- Houston, TX
- 832-406-4873
Depreciation Schedule (straight line method)
- Home
- Depreciation Schedule (straight line method)
Instead of calculating each ratio individually
Let our ratio tool instantly calculate your ratios. Input your financial data once and get multiple results.
Straight line depreciation
Straight line depreciation =
(Cost of asset – Salvage Value)
Useful Life
INTERPRETATION
The straight line method calculates the depreciation expense for each asset and allocates the cost of each asset over the useful life.
Business owners, managers, and other interested parties use it to record the depreciation of assets whose book value steadily drops over time.
Note: expanded calculation
Spread the expenses of the asset evenly over its useful life after subtracting the asset’s salvage value.
EXAMPLE
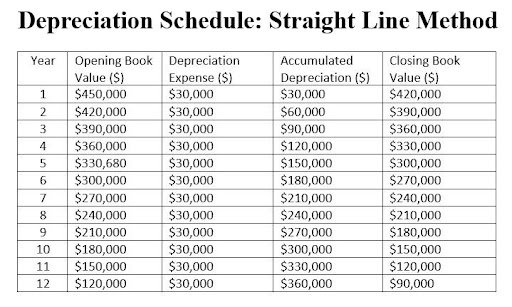
M&M purchased a grinder machine for $450,000. It has an estimated salvage value of $90,000 and a useful life of 12 years. M&M calculates the annual straight-line depreciation.
Description of asset: Grinder Machine
Year (start): 20XX
Cost of asset: $450,000
Residual value (salvage value): $90,000
Useful Life: 12 years
Depreciation Rate: 8.33%
Depreciable Cost: $360,000
SEE: Depreciation Schedule - Straight Line Method
Depreciation Rate = 100% / useful life
Depreciation Rate = 100% /12 years = 8.33%
Depreciable Cost = cost of asset – residual value
Depreciable Cost = $450,000 – $90,000 = 360,000
Depreciation Expense = Depreciation Rate x Depreciable Cost
Depreciation Expense = 8.33% x 360,000 = $30,000
Accumulated Depreciation = Depreciation Expense + Accumulated Depreciation
Accumulated Depreciation (year 2) =$30,000 + $30,000 = $60,000 in year 2
Closing Book Value = Opening Book Value – Depreciation Expense
Closing Book Value = $450,000 – $30,000 = $420,000
BENCHMARK: ROT
This method is used to calculate depreciation on machinery that you expect to use until you scrap it.

Straight line depreciation :
ABBREVIATION KEY:
ROT: Rule of thumb
HA: Historical Average (organization’s historical average)
PG: Peer Group average
EB: Economic Benchmark
DISCLAIMER: The interactive calculators on this site are self-help tools intended to help you visualize and explore your financial information. They are not intended to replace the advice of a qualified professional. Because each business is different, we can not guarantee accuracy.
